I've got my eyes on you,
So best beware where you roam
I've got my eyes on you,
So don't stray too far from home
This is an uncertain time, no doubt. Like a hawk scouting its prey, all of us latch our sight on every running indicator that gives us even the slightest clue where this crazy, unpredictable world is going to lead us to.
According to the BEA, real GDP contracted by 1.4% annualised in the first quarter of this year, a surprising 2.4pp below consensus. If the second quarter of this year’s growth contracts as well, then that is technically the dreaded recession.
How certain can we be of the future given this GDP reading? The difficulty in using GDP to guide real-time policy, especially for this one made to order “monetary-policy-that-is-arriving-rather-late-but-now-to-be-carried-out-expeditiously”, is that GDP does not monitor real-time growth.
Governor Waller, in his recent May speech said that, “If we knew then what we know now, I believe the Committee would have accelerated tapering and raised rates sooner. But no one knew, and that’s the nature of making monetary policy in real time”.
“If we knew then what we know now”- indeed.
The shortcomings of looking exclusively at GDP as a measure are plenty: it comes out only quarterly, it is restricted to aggregate expenditure data to measure output, no surveys are taken into account, it ignores the wage pressure in the labour market, it is influenced by volatile spending and it doesn’t give a fig about the direction and speed of the underlying growth.
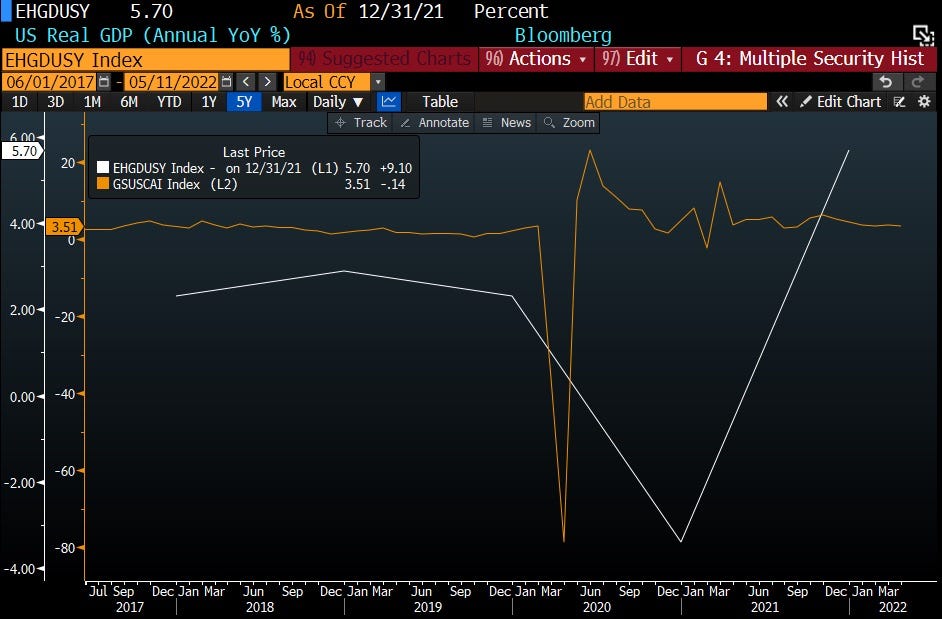
Fortunately, there are more timely alternatives such as the Current Activity Indicator (CAI). It provides a correlations-based summary measure of growth using a broad range of weekly and monthly indicators. The chart above shows US real GDP (Annual YoY %) vs. CAI. The lines showing CAI dipped sometime in March 2020 and this was followed by US real GDP (Annual YoY %) announced several months later.
To give a feel for the US CAI in the long term, I’ve gone as far back as the 1970s. The dips in the chart above correspond to well-known shocks to the economy over the past decades.
Zooming in on the time period between 1st January 2019 and 9th May 2022, CAI has been close to trend since the middle of last year, averaging around 3.5%. During the recession of March-April 2020, which lasted all but 2 months and is the shortest recession in history, CAI fell by an unprecedented 80pp before shortly recovering and even briefly overshooting the trend.
The briefness of the 2020 recession is novel. Perhaps this pattern of brevity was a one-off and can be explained by effective monetary policy and other factors at the time. Nonetheless, it bears thinking whether it is possible, akin to the phenomenon of flash floods in big cities after a deluge of rain, that we would see this pattern of ‘flash recessions’ playing out consecutively, over and over again during the coming years.
Maybe to have a better picture of the future we need to know the answers to these questions: whether prices for crucial goods would keep jumping sky high every time there is a hint of scarcity or experience lower volatility as further investment in production capacity is made, whether the pandemic is still a raging fire or a dying ember, whether China will stop its severe lockdown policy and enable the global supply chain to run full-throttle, whether Russia is still hungry for more bloodshed in Ukraine, and many other unresolved issues.
Perhaps constantly guessing the endgame and having to unceasingly course-correct, trying not to be wrong-footed by what may come next, will result in more, albeit milder, ‘flash recessions’. Wary of facing another recession, we might actually want to look at what we can surmise from growth factors. To help us, there are a few key growth propellers we can examine such as fiscal stimulus, pent-up savings, financial conditions and net trade - though not to make this newsletter too long, I’m skipping in-depth discussion of private consumption.
Fiscal stimulus
The impulse peaked in 2021Q2 as the stimulus checks stopped coming in and has been declining throughout the year. Several unemployment benefits expired last September, as well as the $300 weekly top-up.
Decreasing stimulus and drawn down pent-up savings produce increasing fiscal drag on the GDP which could amount to 4pp. More spending on services as the economy reopens may mitigate this. Presumably, the risk of recession stemming from fiscal drag as it grows larger is greater than the risk carried by an uncalibrated monetary policy - policy can be adjusted post-observation but withdrawal of stimulus is very difficult to reverse.
Pent-up savings
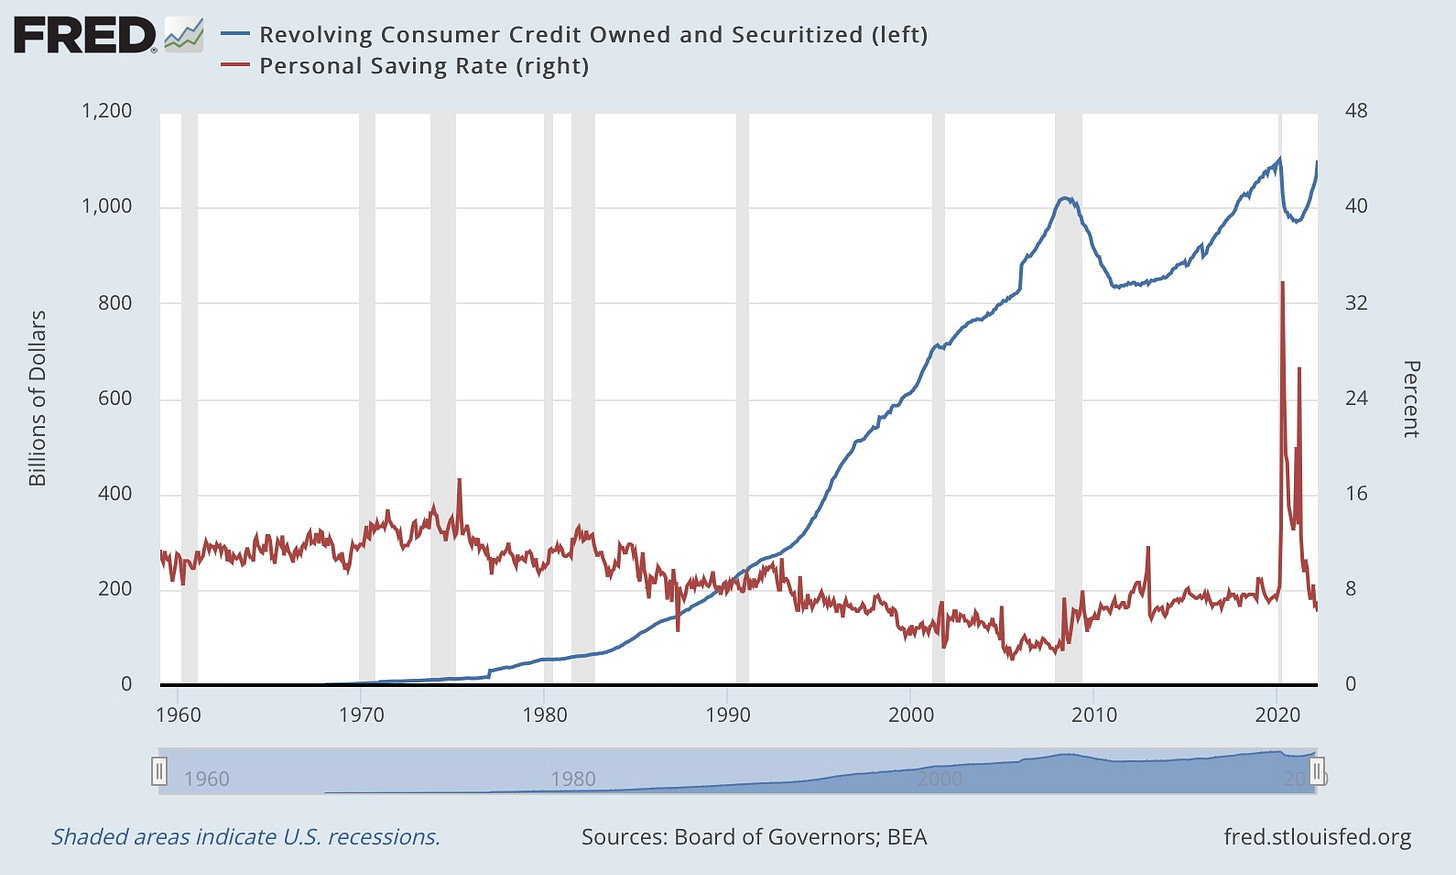
Households had almost $2.5tn in excess savings because there was nowhere to spend it on during the pandemic. Most of household savings sit in bank deposits and reopening would entice a significant percentage of this savings to be spent. Having said that, below is a chart of revolving consumer credit owned and securitised vs. personal saving rate:
Personal saving rate (PSAVERT) charts personal saving as a percentage of disposable personal income (DPI). Personal saving rate spiked during the pandemic and is now showing a significant fall of about 27pp from peak.
This observation, coupled with a noticeable upturn in consumer credit could mean that households are reducing savings, on top of having to increasingly draw down their pent-up savings. The rise in consumer credit indicates more households are relying on credit to get through this period of higher inflation.
The sustainability of increased reliance on credit depends on its continuing availability for households. In addition, the tightening of financial conditions may even put some households into a precarious position.
Financial conditions
I have written at length in the previous newsletter on financial conditions so I’m not going to expand much here. They are currently tightening in response to lower equity prices, anticipated rate hikes by the Fed, widening credit spreads and a revised view on growth. Financial conditions can also change due to the revision of risk sentiment or expected changes in other economic outcomes. Ultimately, large enough tightening of financial conditions can trigger a recession.
Net trade
Accounting wise, imports made up more than the total fall in GDP last quarter, taking 2.5pp off. Some may say this fall stems from companies front-loading purchases in anticipation of Ukraine invasion-related shortage, or from increased consumption, or from investment in equipments, or some combination of all of them. It’s actually quite rare that imports play a part in the fall of the GDP, the nearest we came to an example of an import drag would be when Trump declared trade war with China and even then, the size is minimal as the US is a relatively closed economy.
Strictly speaking, imports do not reduce economic output, the M in (X-M) is merely an accounting variable instead of an expenditure variable. Although the purchase of domestic goods and services should increase the GDP, the purchase of imported goods and services should have no direct impact on the GDP. Do check out the site at St. Louis Fed for more explanation why this is so.
As for exports, every $10/bbl increase in oil prices reduces US GDP growth by 0.1pp, and every 1pp decline in European growth reduces US growth by 0.05pp via the export channel. To add, in general, as the level of commodities inventories fall, volatility of prices increase.
Private sector financial balance
We could also look at the private sector financial balances for signs of distress in the economy. Recessions are somewhat less likely in a hiking environment if those balances are healthy. In addition, a less fragile private sector can help prevent recessions even if the unemployment rate rises - providing it is not by a huge amount. This sector resilience also means that businesses have some leeway dealing with wage rises and increasing capex without necessarily having to resort to more financing by credit or issuing more shares.
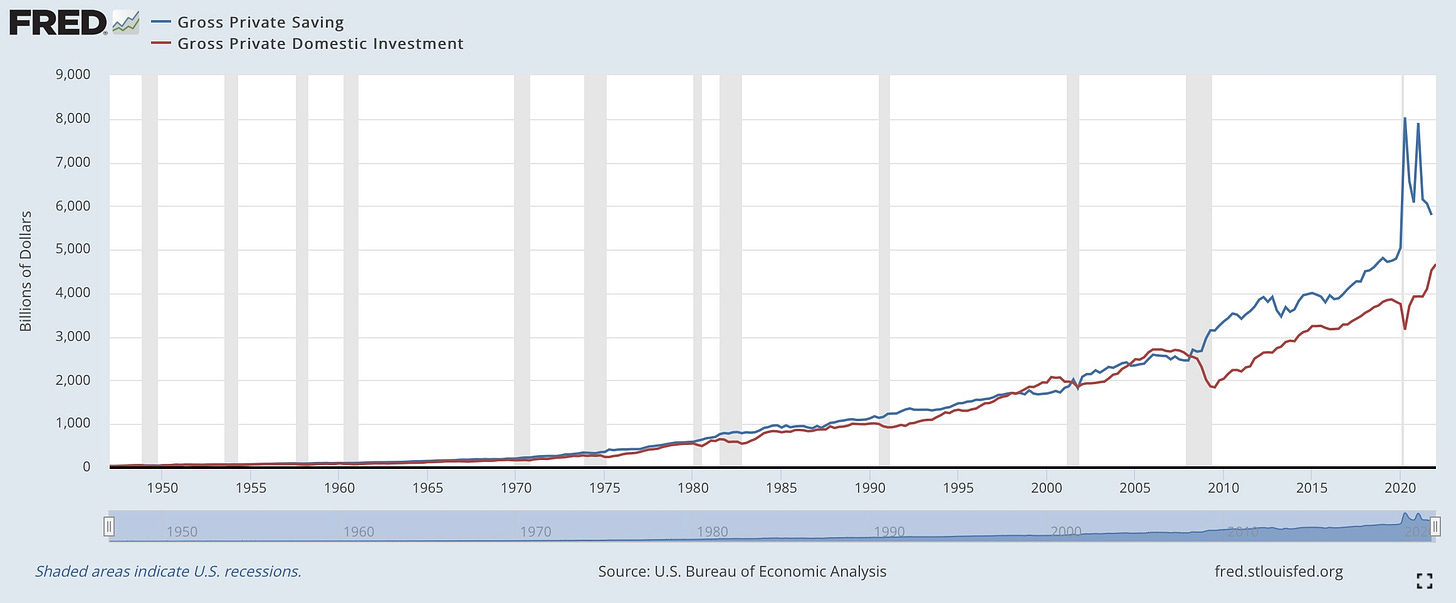
Above is a chart of gross private saving (GPSAVE) and gross private domestic investment (GPDI). The difference between the two lines (S-I) gives us the amount of surplus.
Private sector financial balances showed some resiliency by running a surplus at 8.1% of GDP in 2021 and possibly… (finger in the air)… coming around 6% of GDP in 2022. However, the strength of this surplus means that the Fed might have to aim for higher funds rate. Consequently, at the other end of the spectrum, the Fed must also be on the lookout for the risk of overdoing the hike. In my previous newsletter I discussed at length the importance of the Fed pivoting well and in a timely manner.
So many more indicators we can look at to ascertain growth and the probability of recession such as cyclicals versus defensives valuations, P/E ratios, credit spreads, as well as Fed funds and the terminal rate.
Caution though, when looking at market-implied rates we must remember that what is priced by the markets comprises of a complex combination of probabilities of different outcomes rather than a definite, simple, single path.
The question of recession
Having looked at these growth factors, we know that fiscal stimulus has been largely withdrawn, pent-up savings are being spent down and financial conditions are tightening, although some respite is to be had from net trade as that drag may be a one-off. All these point to a possible further contraction of GDP in the near term.
On the other hand, reduced impact of the pandemic on the economy, reopening of services and strong spending in this sector, and perhaps even the end of Covid Zero policy in China and the resolution of Ukraine invasion (who knows, miracles can happen) could be a holding dam against the tidal forces of recession.
Until the next newsletter, I leave you with a saying from Albert Einstein, who said that,
“Not everything that counts can be counted, and not everything that can be counted counts.”
I too, am keeping that in mind while I sort various bits of information and charts in my head, trying to get a feel for those released figures - comforting they are not - and continue pretending to myself that the future can be so easily predicted.
Bonus tidbits:
A. “Cooling an over-heated, capacity-constrained, hyper-financialised economy, in a time of deglobalisation and war, without first tightening financial conditions is proving rather difficult. Like all complex problems, this one took decades to create. Back when the US economy had less debt and leverage, when financial assets had lower valuations, and when wealth was less concentrated, the ups and downs of the real economy drove financial markets.
In such a world, the Fed quite easily used conventional rate policies to influence our behaviours to achieve their objectives. When those became less effective, they introduced unconventional policies, and forward guided their intentions to become highly predictable. The effect was the hyper-financialisation of our economy. Now, with such high levels of debt, leverage, valuations, and wealth-concentration, it is financial markets that drive the real economy, not the other way around. We have never experienced a modern economic cycle that looks anything like this. And Dudley may be right in his prescription. But if it is one thing, it is certainly not certain.”
Ht Tony Pasquariello, from a piece on April 17th by Eric Peters, One River Asset Management, who shares his thoughts every Sunday (not last Sunday, though).
B. The accounting of private sector financial balance is as such: Private Sector Balance = Household Balance + Business Sector Balance = Gross Private Saving - Private Domestic Investment = Current Account Balance - Government Balance


